
This article covers releases v1.10.0, v1.10.1, v1.11.0, v1.11.1, v2.0.2, and v2.1.0 of the ESP-IDF Extension for VS Code.
The biggest story across these releases is the integration of the Espressif Installation Manager (EIM) — a standalone tool that replaces the extension’s built-in setup wizard and unifies how ESP-IDF is installed across all tools and environments. Alongside that, the extension has gained deeper debugging capabilities, AI-assisted workflows, a native UI refresh, and a host of other developer experience improvements.
EIM Integration#
If you haven’t read our dedicated EIM release article, we recommend starting there: ESP-IDF Installation Manager v0.8.
EIM is a standalone, cross-platform tool available via winget, brew, apt, dnf, or a direct binary download that manages ESP-IDF installations uniformly, regardless of which tool triggered the install. Once EIM has installed ESP-IDF, any tool that understands EIM’s eim_idf.json manifest — including the VS Code extension — can discover and use those installations automatically, with no manual path configuration needed.
To install ESP-IDF, open the Command Palette and run:
ESP-IDF: Open ESP-IDF Installation Manager
Depending on your environment, EIM will open in one of two ways:
- Graphical interface (GUI): On a desktop machine, EIM opens as a standalone window that guides you step by step through selecting and installing an ESP-IDF version, with no command line required.
- Terminal wizard: In SSH sessions, Dev Containers, Codespaces, WSL, and other non-GUI contexts, the extension automatically falls back to an interactive terminal program that walks you through the same steps in your console.
Once ESP-IDF is installed, the extension reads the eim_idf.json file EIM produces and discovers all installed versions automatically.
GUI:
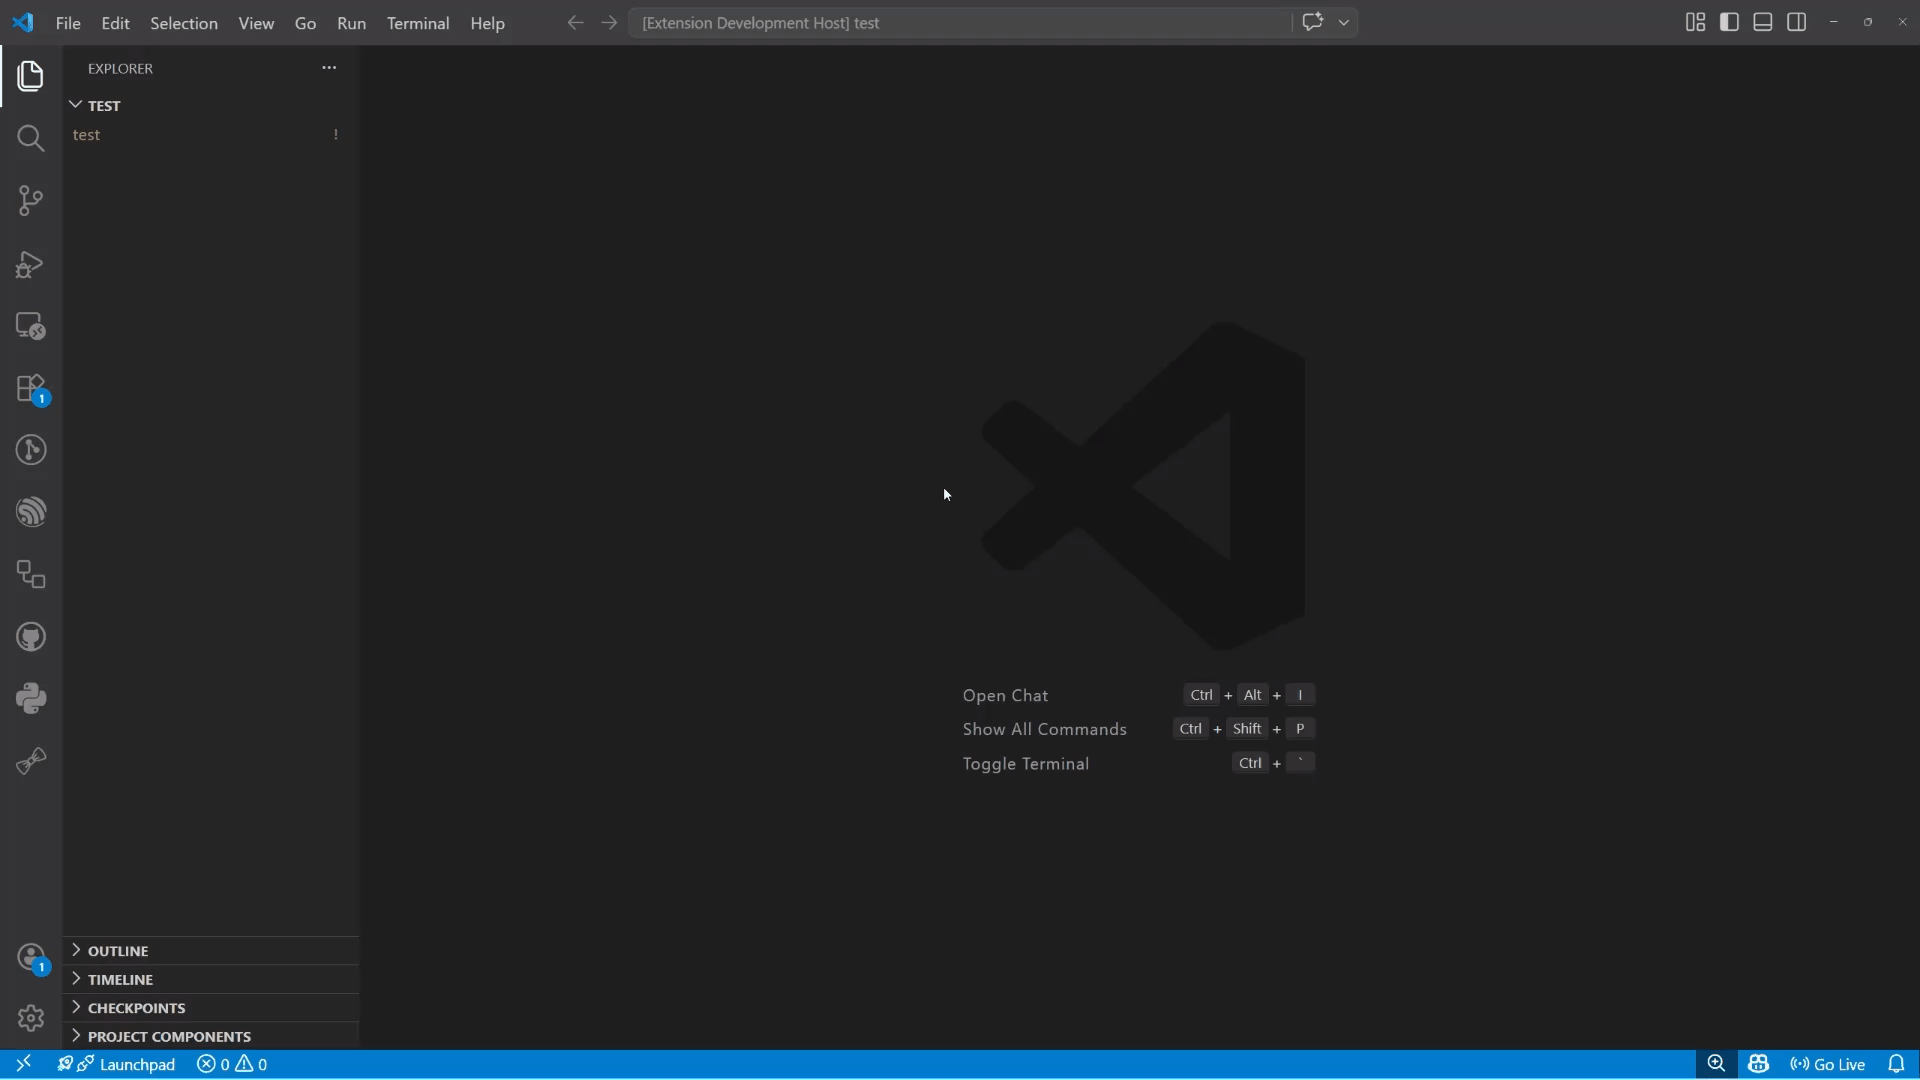
EIM GUI installation
Terminal wizard:
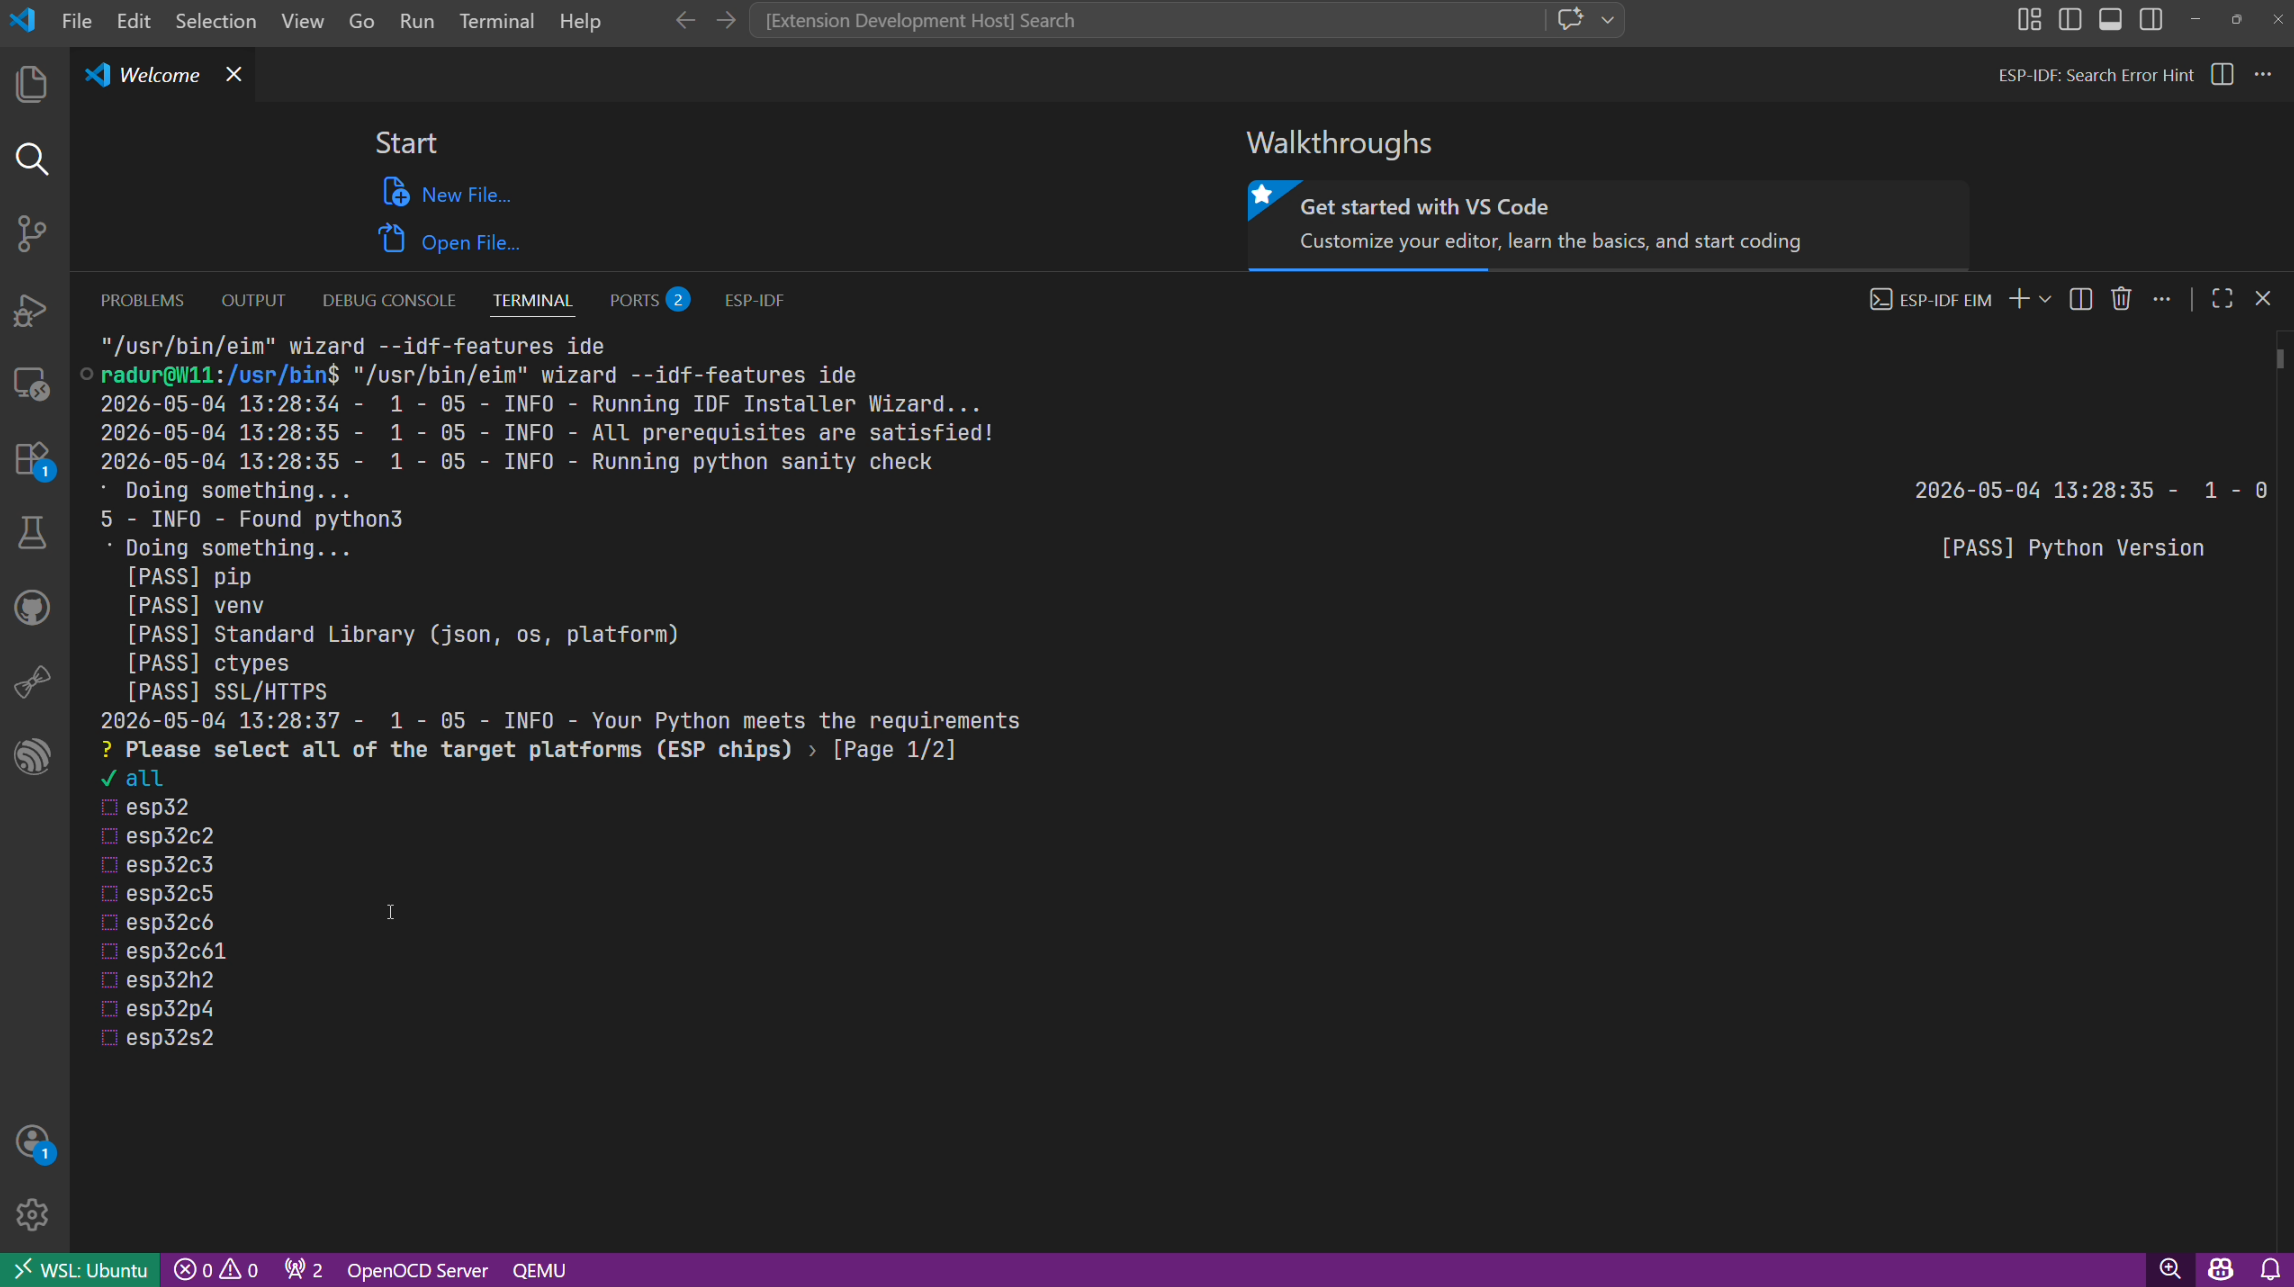
EIM terminal wizard
For a detailed walkthrough of each step in the GUI installer, refer to the Online Installation using EIM GUI guide.
To switch between multiple installed ESP-IDF versions, use:
ESP-IDF: Select Current ESP-IDF Version
The selected version is stored in the workspace state as idf.currentSetup, and all required environment variables are set automatically.
Backward compatibility: Existing setups using environment variables in
idf.customExtraVarscontinue to work. The extension will use those over any EIM-managed setup when present. See the updated installation documentation for full details.
Installed ESP-IDF to a Custom Path via EIM CLI? (Advanced)#
Most users can skip this section. This only applies if you used the EIM command line interface with custom path flags such as
eim install -p D:\YourCustomPath. The EIM GUI always installs to the default location and is detected automatically.
If you installed ESP-IDF to a non-default location using the EIM CLI, the extension may not detect your installation automatically. Set the idf.eimIdfJsonPath extension setting through Preferences: Open Settings (UI) to the full path of your eim_idf.json file.
See the EIM FAQ on custom installation paths for the full list of EIM CLI path options.
v2.0.2 / v2.1.0 - EIM Integration and Developer Experience#
Why We Made This Change#
Previously, installing ESP-IDF via the extension required users to navigate a custom setup wizard embedded directly in VS Code. It worked, but it was hard to maintain, inconsistent across platforms, and disconnected from ESP-IDF installations done outside of VS Code, for example on the command line, in CI, or by another IDE.
EIM solves all of this. Because it is a standalone tool, an ESP-IDF installation performed via EIM — whether through the GUI, the CLI, or another IDE — is automatically visible to any tool that reads eim_idf.json, including this extension.
What Was Removed in v2.0.2#
This release cleaned up a significant amount of legacy surface area:
- Old Setup Wizard (
ESP-IDF: Configure ESP-IDF extension) - replaced by EIM idf.espIdfPathandidf.toolsPathsettings - replaced by environment variables derived from the selected EIM setup- Old debug adapter - replaced by the Eclipse CDT Debug Adapter, added in v1.8.0
- ESP-MDF, ESP-Matter, ESP-HomeKit framework integrations - these frameworks are now available in the ESP Component Registry, which is accessible directly from the extension. Note that ESP-ADF support is retained.
- The
ESP-IDF: Show Examplescommand has been removed in favor ofESP-IDF: New Project, which now provides a superset of its functionality with better customization options.
EIM in Remote Environments (v2.1.0)#
v2.1.0 extended EIM support to SSH sessions, Dev Containers, Codespaces, WSL, and other non-GUI contexts. The extension now consistently falls back to the terminal wizard in these environments rather than attempting to launch a GUI. See the EIM Integration section above for the full setup flow.
Categorized Extension Settings (v2.1.0)#
The extension settings have been reorganized into clearer categories in the VS Code Settings UI. Instead of presenting ESP-IDF-related options as one long flat list, settings are now grouped more logically, making it easier to discover the right option when configuring build, flash, debug, tooling, or installation behavior.
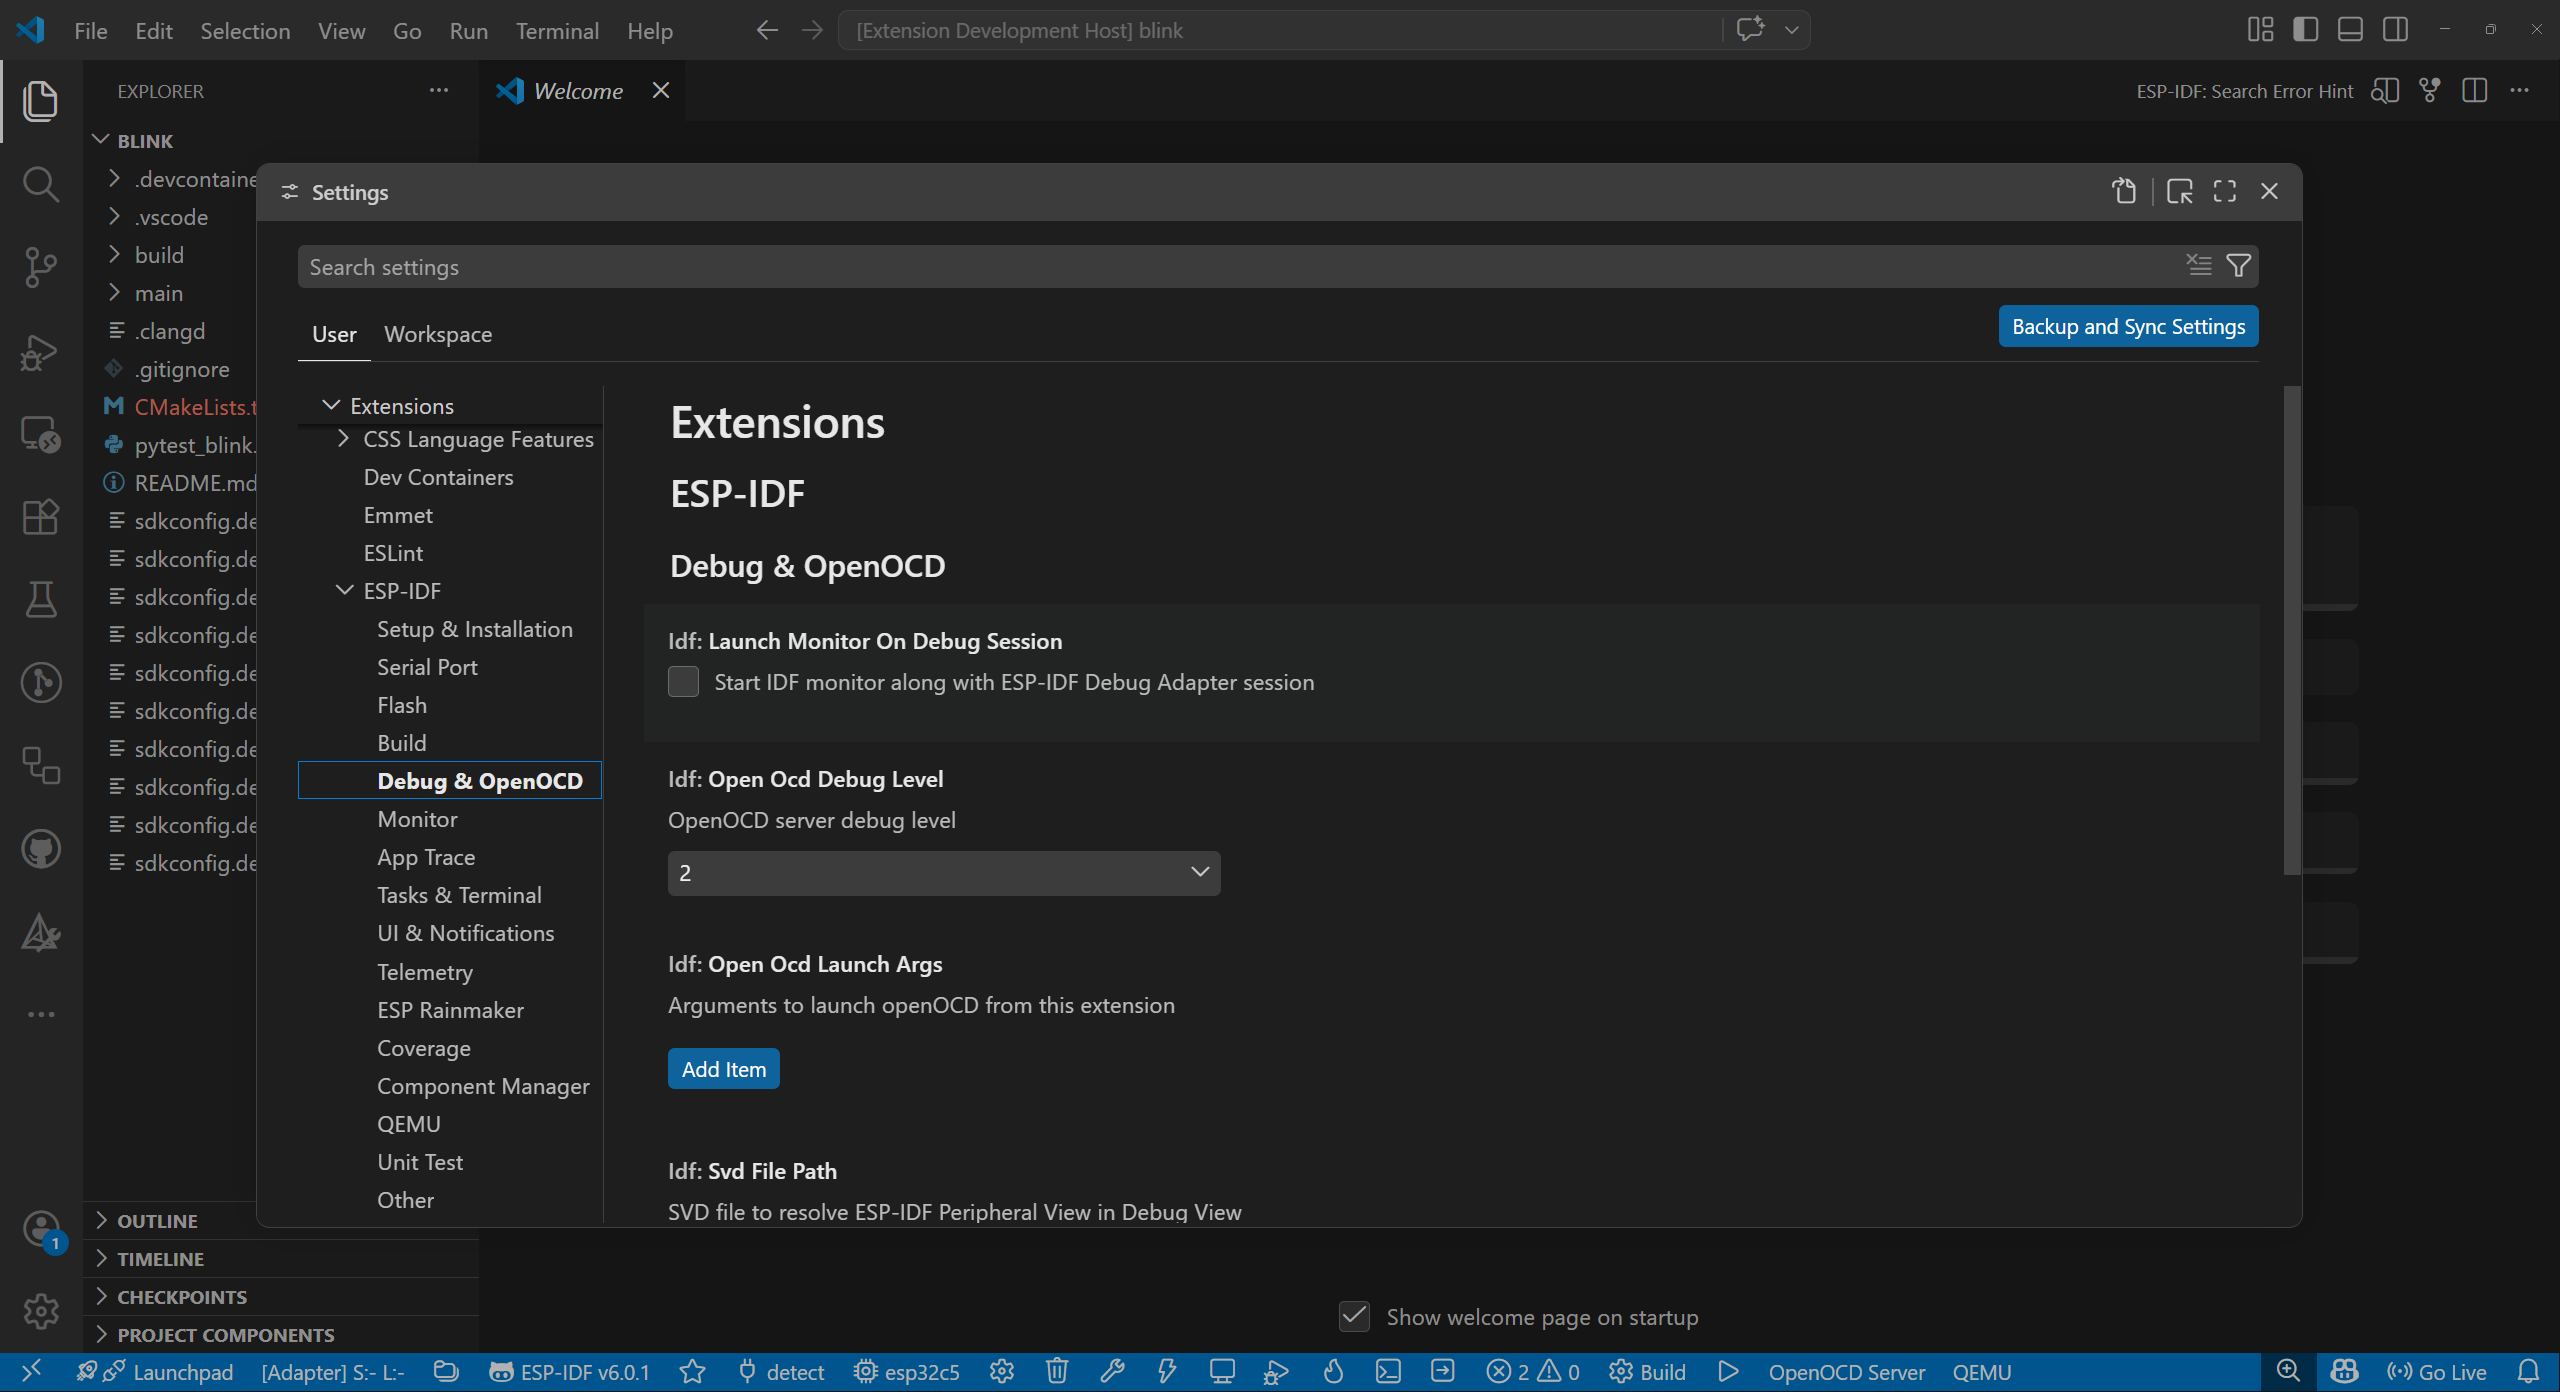
New Settings UI Categories
Automatic Clang Server Restart After Build Changes (v2.1.0)#
The extension now restarts the Clang language server when compile_commands.json changes. Before this update, IntelliSense and code navigation could become stale after a build or reconfiguration step unless the language server was restarted manually.
With v2.1.0, the extension keeps Clang-based project analysis in sync automatically, reducing those moments where diagnostics or code completion lag behind the actual project configuration.
New Project Wizard: Templates First (v2.0.2)#
The New Project Wizard now shows available project templates before asking for configuration details. This makes it much easier to browse and choose a starting point before committing to a configuration.
Debug Image Viewer (v2.0.2)#
v2.0.2 ships a new Debug Image Viewer that lets you visualize C image arrays directly from your debugging session or from files on disk.
Out of the box, the viewer supports OpenCV and LVGL image formats. You can also configure custom image data types as long as you can provide a UInt8Array and a size or length, making it adaptable to any frame buffer layout your firmware uses. See the ESP-IDF Image Viewer documentation for full details.
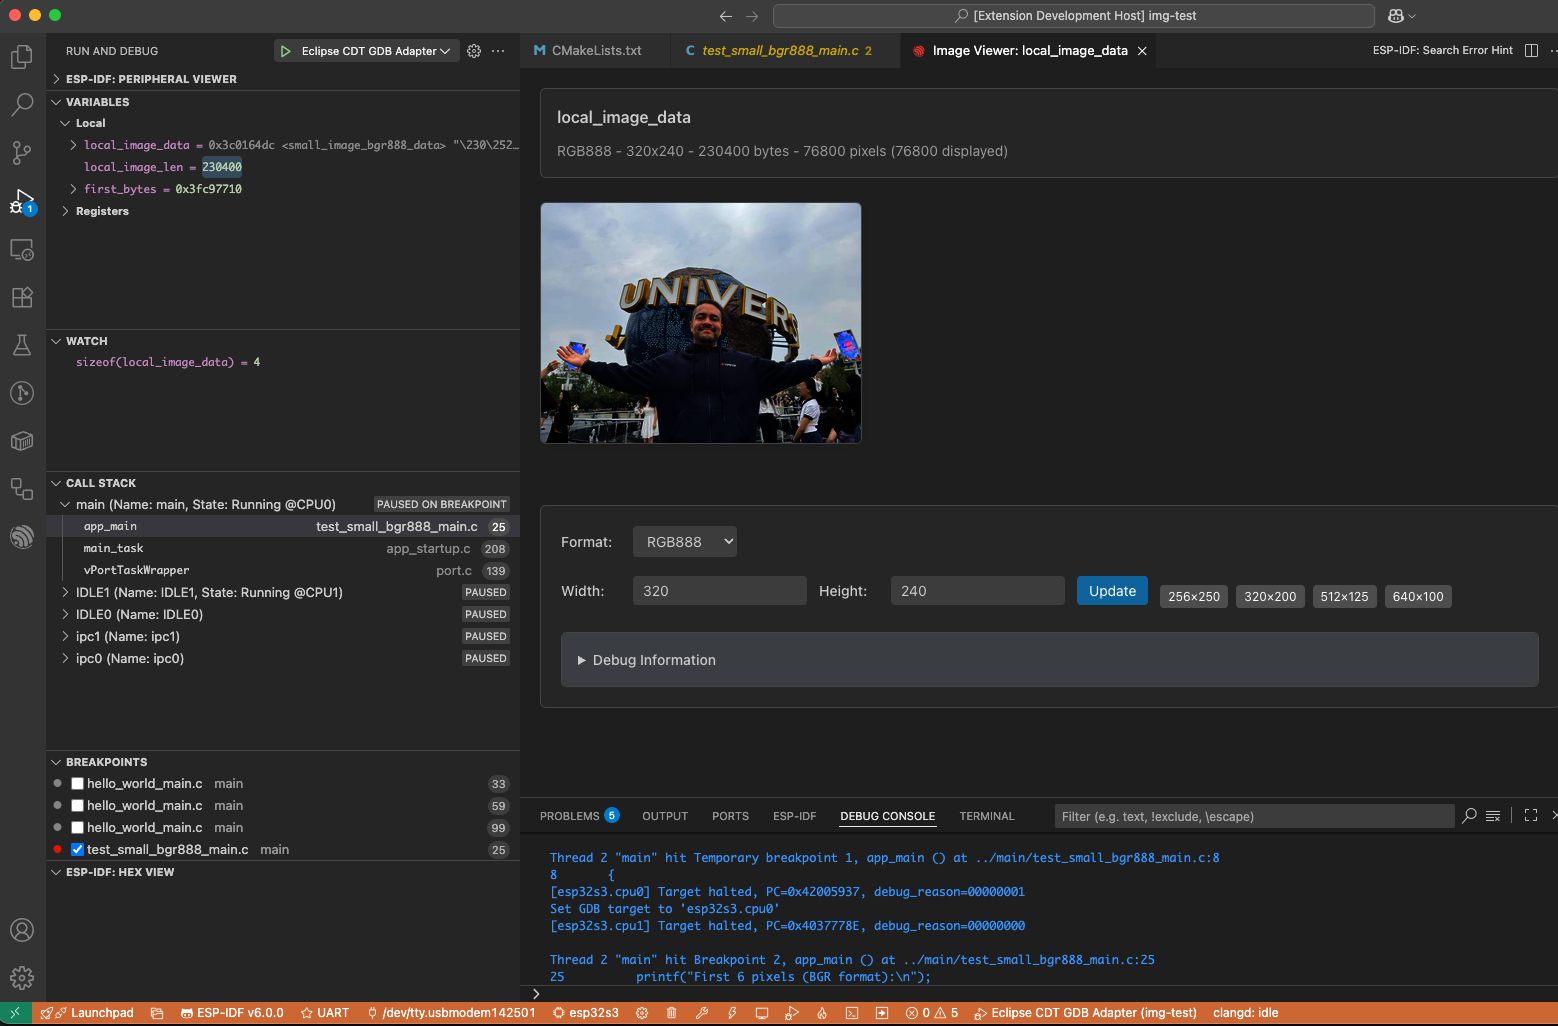
Debug Image Viewer rendering a C image array
Other Notable Improvements and Fixes (v2.1.0)#
For ESP32-P4 users, debug sessions now expose PIE registers, making low-level inspection more complete on that target. v2.1.0 also includes several practical fixes that improve reliability in real projects, including better activation support for VS Code Snap installs, correct activation for manual non-EIM setups, improved sdkconfig path resolution, proper use of environment variables defined in idf.customExtraVars, and better shell compatibility by using sh for activation scripts and the IDF Terminal on Linux environments.
v1.11.0 / v1.11.1 - AI, DevKits, and a Richer Developer Experience#
AI Integration with GitHub Copilot Chat#
v1.11.0 introduces a Language Tool API integration for GitHub Copilot Chat. When you use Copilot Chat in a project with the ESP-IDF extension active, it gains ESP-IDF-specific context such as your IDF version, target chip, and project configuration, enabling more accurate and relevant suggestions for embedded development tasks. Beyond answering questions, Copilot Chat can also invoke ESP-IDF extension commands directly — for example, asking it to clean the build folder and trigger a rebuild without leaving the chat. See the ESP-IDF Chat Commands documentation for the full list of supported commands.
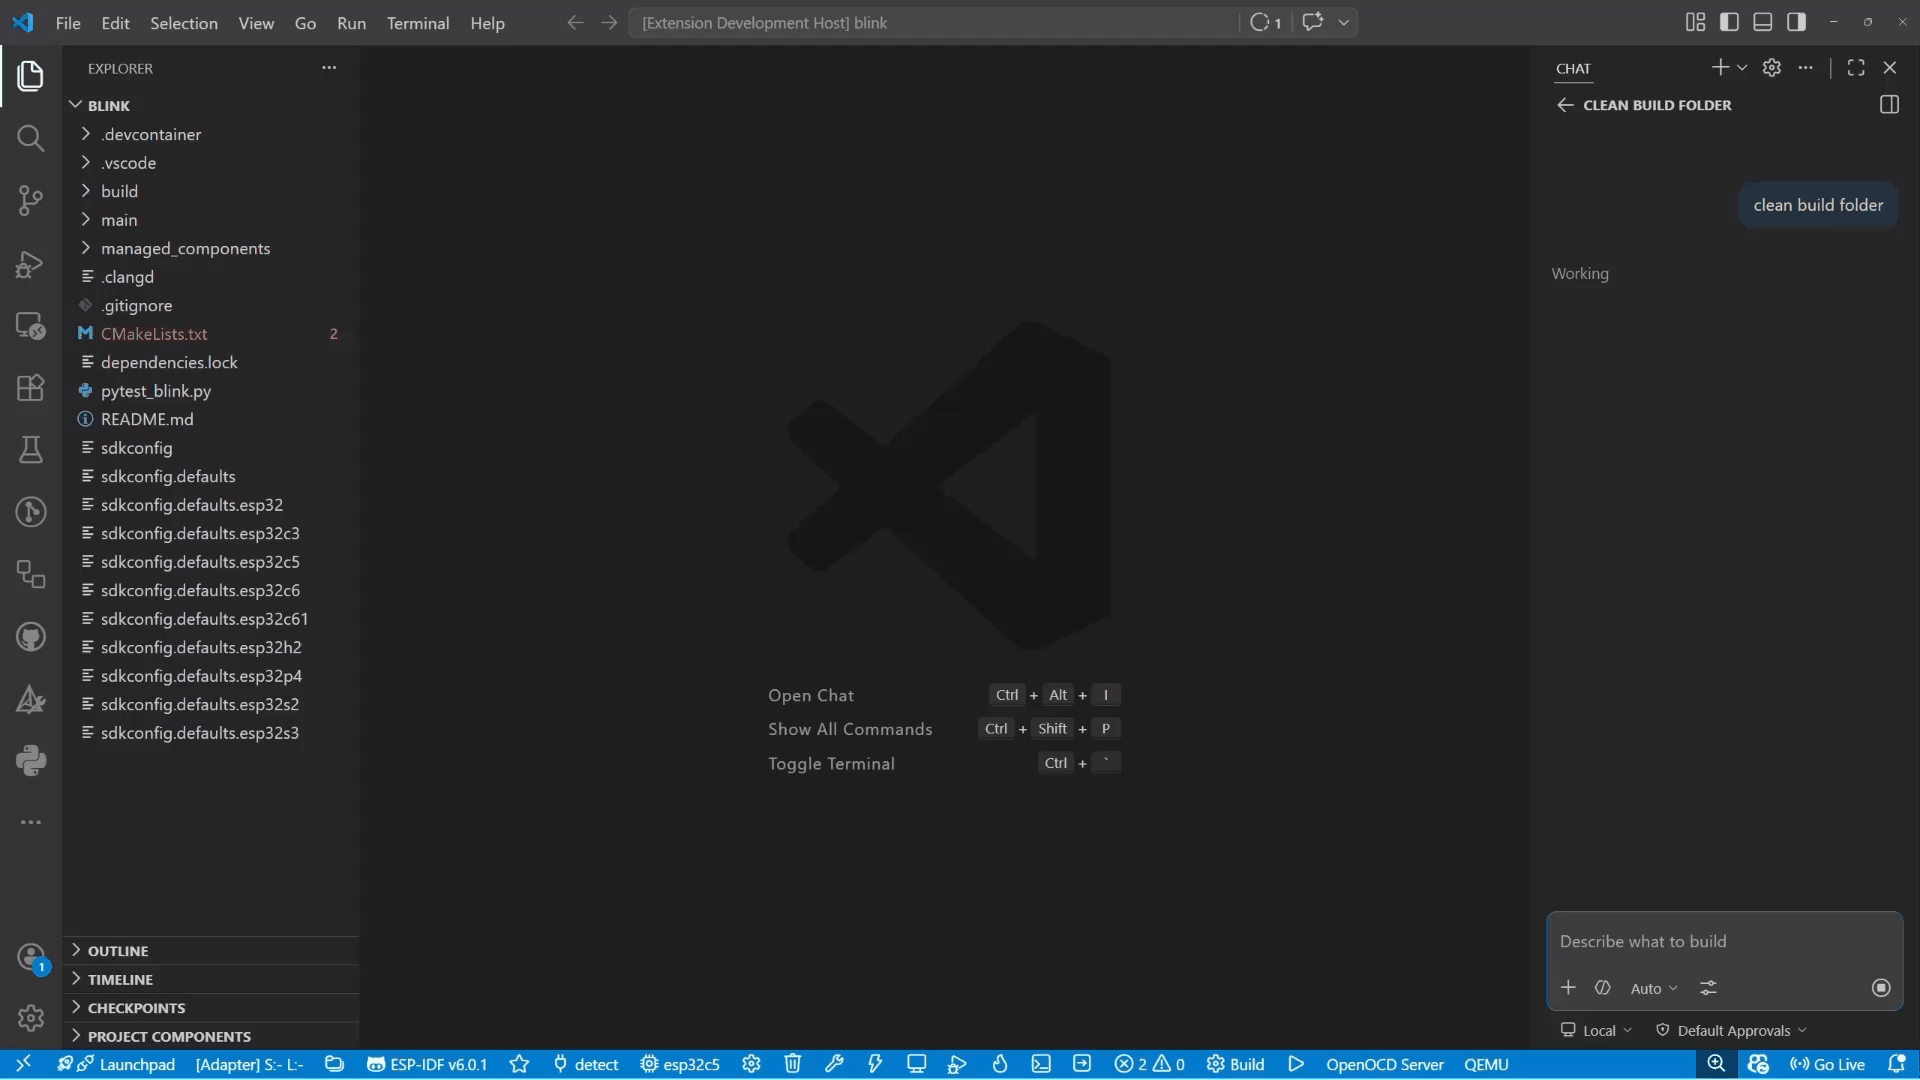
Copilot Chat cleaning the build folder and triggering a rebuild via ESP-IDF extension commands
DevKit Support#
A long-requested feature: the extension now has explicit DevKit support. When you select your target chip and board, the extension can recognize official Espressif development kits and apply board-specific defaults, reducing the manual configuration needed when starting a project on a known board.
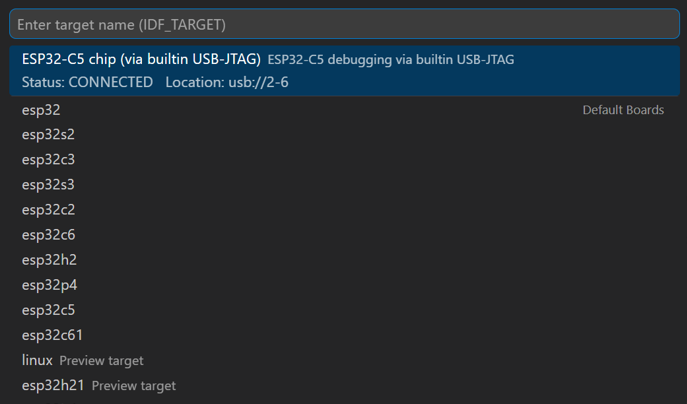
Set Espressif Device Target with DevKit options
Classic Menuconfig in the Editor Panel#
The SDK Configuration Editor now includes a classic Menuconfig view embedded directly inside VS Code, alongside the existing graphical editor. This gives developers who prefer the terminal-style navigation of idf.py menuconfig a familiar experience without leaving the IDE, accessible via the ESP-IDF: Open Classic Menuconfig Terminal command.
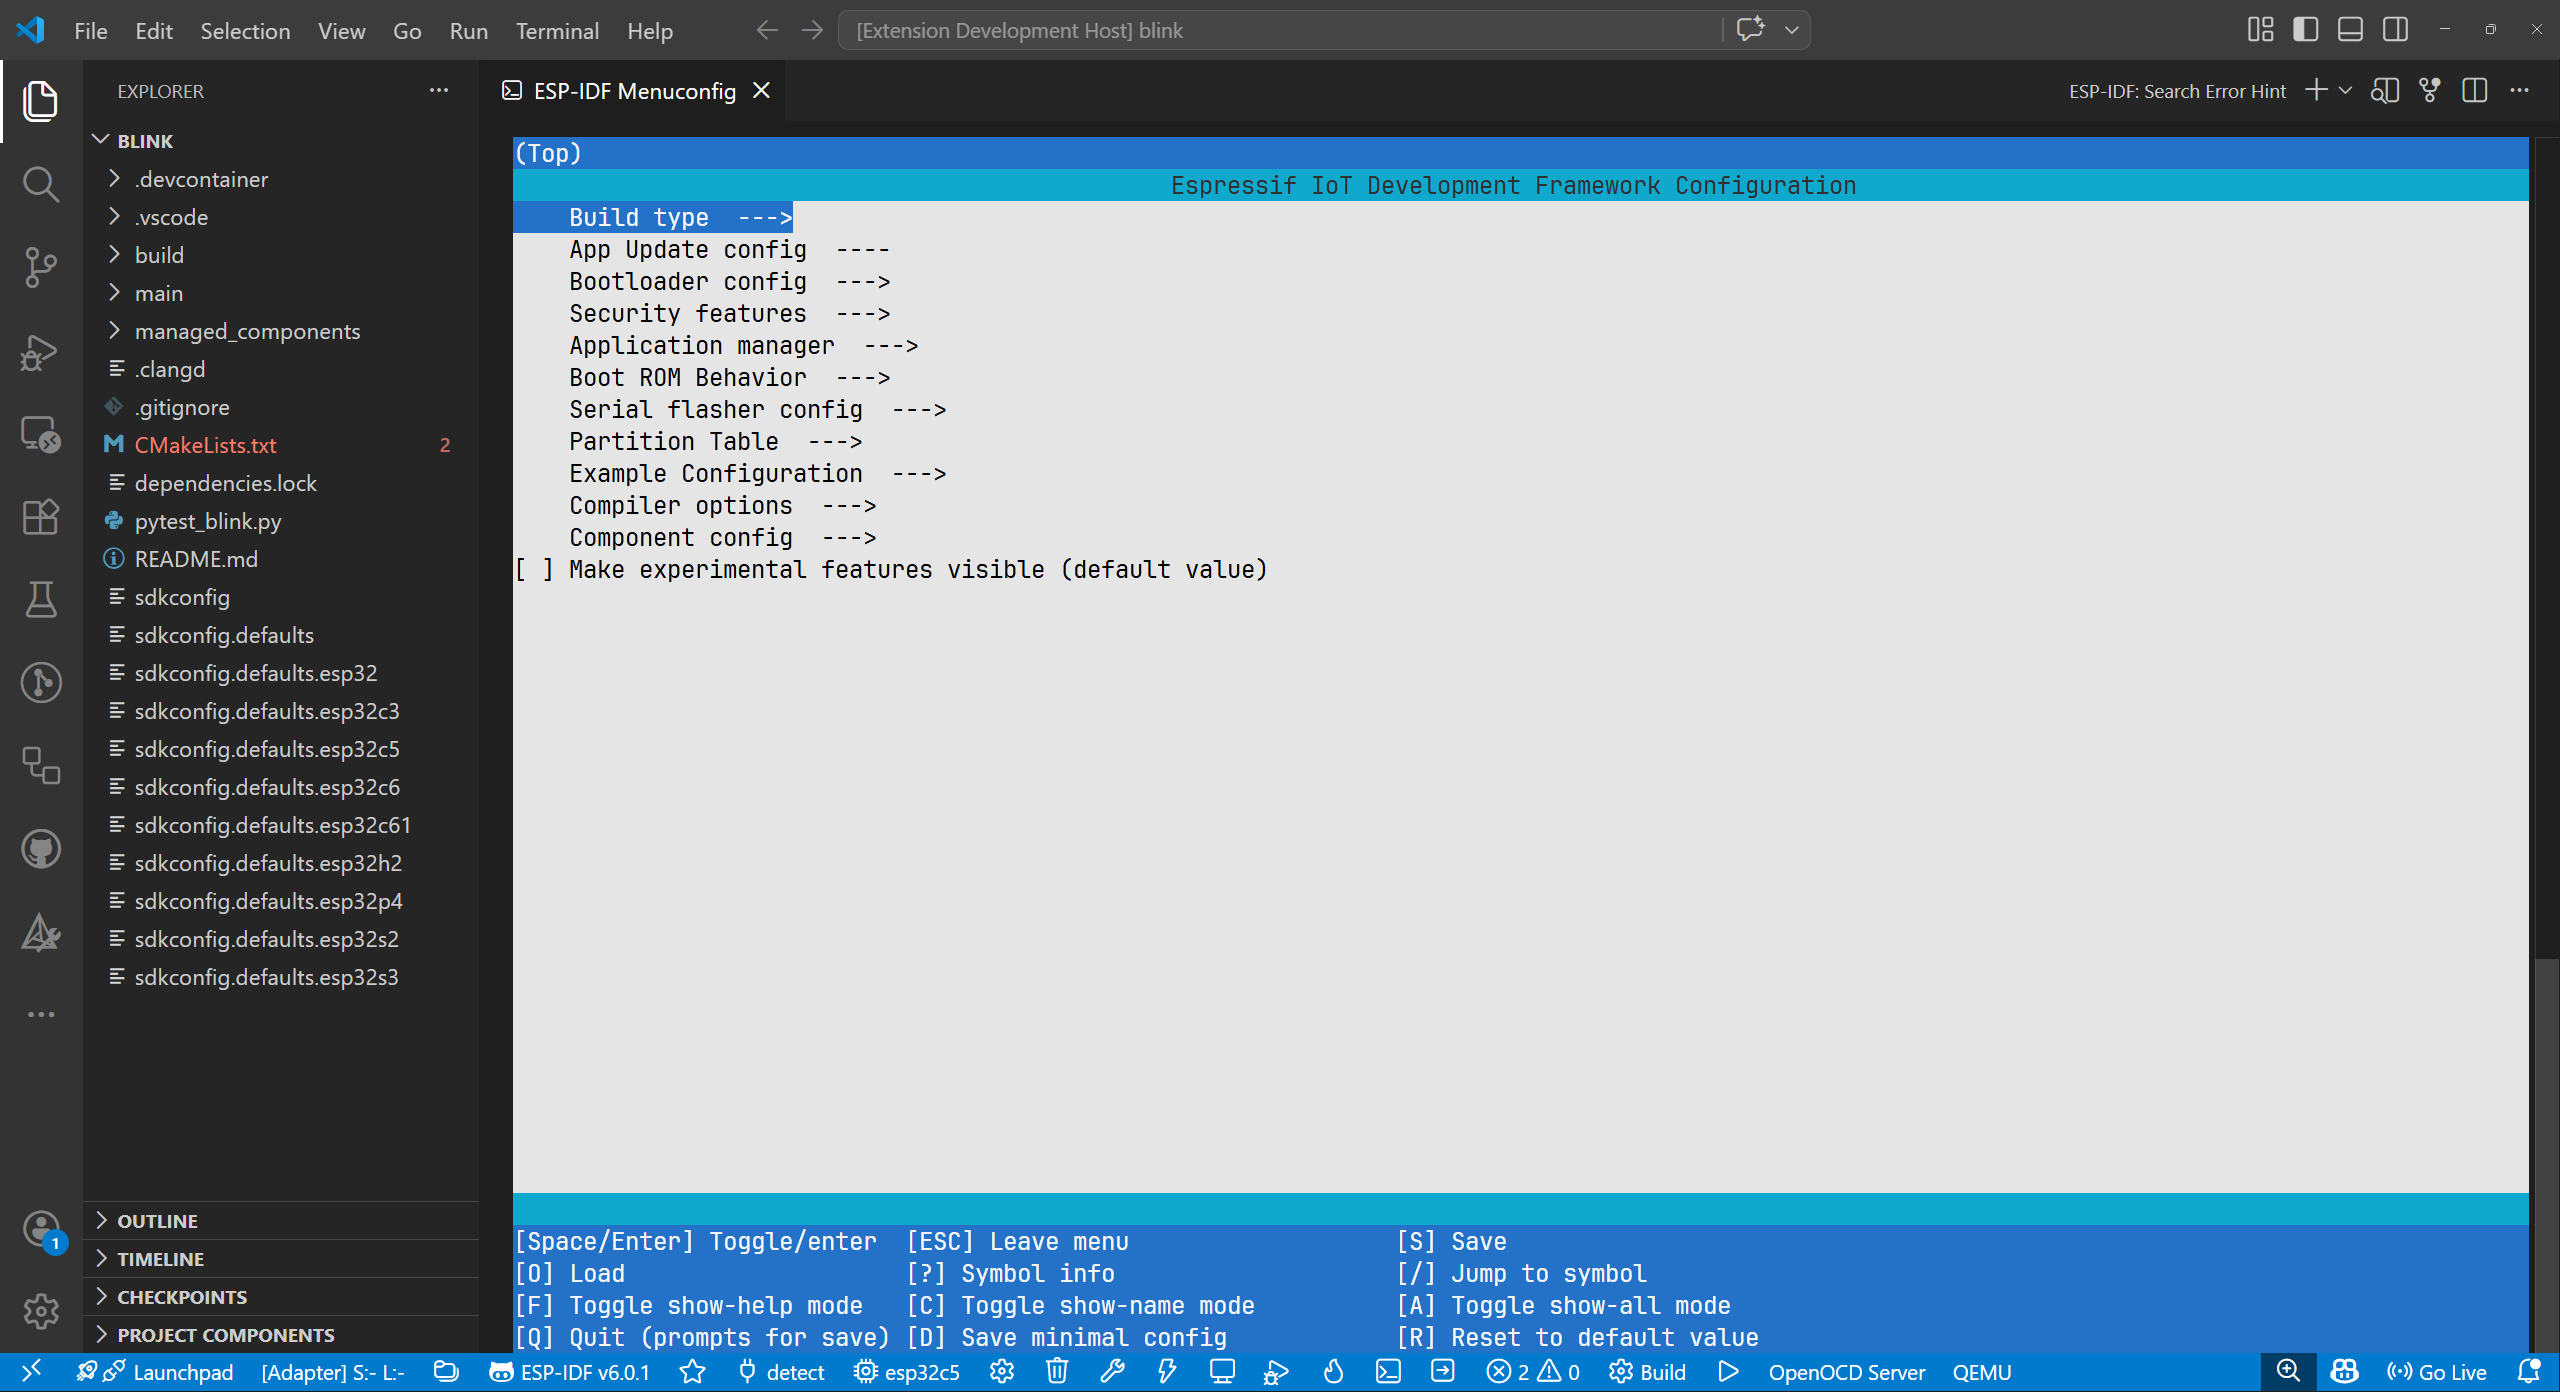
Classic Menuconfig view in VS Code
Modernized UI: VS Code Native Styling#
All extension webviews have been updated to use VS Code’s native UI toolkit, making panels like the New Project Wizard, SDK Configuration Editor, and others feel consistent with the rest of VS Code and properly respect your color theme, whether light, dark, or custom.
Unity Test Runner#
v1.11.0 replaces the previous Pytest-based test runner with a dedicated Unity Test Runner and Parser built specifically for ESP-IDF unit tests. The Unity framework is the standard testing framework used in ESP-IDF, and this native integration provides accurate test discovery, execution, and result parsing within VS Code’s Test Explorer.
OpenOCD Hints in the Hints Viewer#
OpenOCD error messages are now surfaced in the Hints Viewer panel alongside ESP-IDF compile hints. If a debug session fails to start or encounters a hardware connection issue, the Hints Viewer will show contextual guidance from OpenOCD rather than requiring you to parse raw output logs.
Smarter Serial Port Detection#
The extension now supports auto-detecting the serial port using esptool.py, and you can configure a default port with a new setting. This is particularly useful in environments with multiple USB-serial adapters connected, where previously you had to manually select the right port on every build and flash cycle.
Disassembly View: Function Names#
The Disassembly view now displays function names alongside addresses, making it significantly easier to navigate and understand disassembled code during debugging sessions.
Create Empty Project Command#
A new ESP-IDF: Create Empty Project command is available for users who want a minimal starting point with just the CMakeLists.txt and main component skeleton, without any sample code.
.gitignore Generated on Project Creation#
All new projects now include a sensible .gitignore by default, preventing build artifacts, optional sdkconfig, and managed_components from being accidentally committed to version control.
Other Notable v1.11.x Additions#
- Clang install prompt: If Clang is needed but not installed, the extension now proactively prompts for installation.
- Customize PyPI index URL in the setup wizard - useful for networks requiring a private PyPI mirror.
- Extend JTAG flash arguments via a new configuration setting.
- Check OpenOCD is running before launching a debug session, preventing confusing startup failures.
- Allow additional files and directories in the Full Clean command.
- Customize Pytest glob pattern and unit test services.
- Pre-release campaign notification - users can now opt into pre-release builds directly from within VS Code.
v1.10.0 / v1.10.1 - Debugging Power and Partition Flexibility#
Variable Inspection Enhancements#
v1.10.1 brings three improvements to the debugging experience:
- Evaluate variables on hover: Hover over a variable in your source code during a debug session to instantly see its current value without needing to add it to the Watch panel.
- View variables as Hex: Toggle the display of integer variables between decimal and hexadecimal directly in the Variables panel, essential when working with register values, addresses, or bitmasks.
- Data breakpoints: Set breakpoints that trigger when a specific memory location is read or written, enabling powerful watchpoint-style debugging without leaving VS Code.
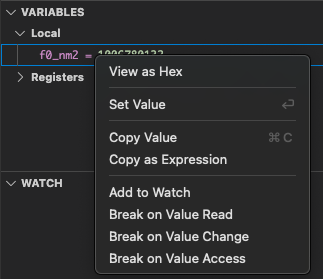
Variable context menu – View as Hex
Partition-Specific Flashing#
v1.10.0 introduces granular control over the flash process:
- Build, flash, and read individual partitions such as the app, bootloader, or partition table independently.
- Read the partition table directly from a connected device.
- Flash a specific binary to a specific partition without reflashing the entire device.
This is a significant workflow improvement for iterative development, especially when the bootloader is stable and you only need to update the application.
These operations are also available as Command Palette commands:
ESP-IDF: Build App
ESP-IDF: Flash App only
ESP-IDF: Build Bootloader
ESP-IDF: Flash Bootloader Only
ESP-IDF: Build Partition Table
ESP-IDF: Flash Partition Table Only
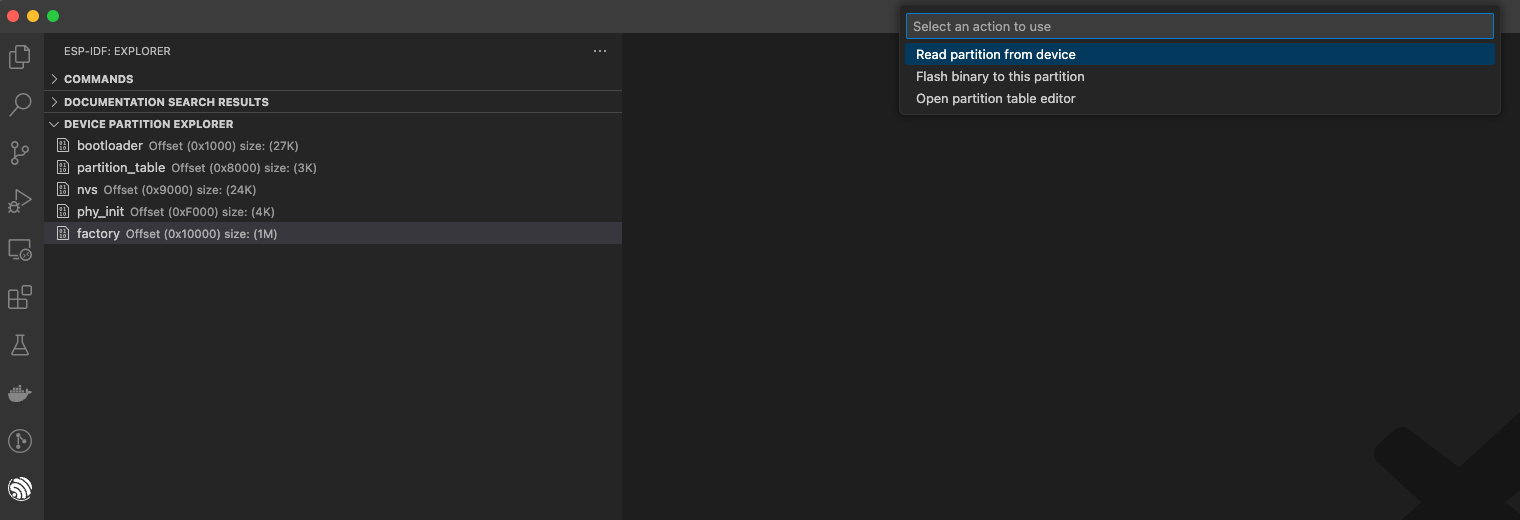
Device Partition Explorer – partition action menu
Clang Project Settings Configuration#
Clang-based toolchain support for static analysis and IntelliSense now has a dedicated configuration UI in the extension settings, making it easier to configure the Clang path and related options on a per-project basis.
ESP-IDF Extension for VS Code Profile Templates#
v1.10.1 introduces VS Code Profile templates tailored for ESP-IDF development. VS Code Profiles let you save and share specific extension configurations, settings, and keybindings, and these templates give you a curated starting point optimized for Espressif development.
Active OpenOCD Board Indicator#
When selecting an OpenOCD board configuration, the extension now highlights the currently active board in the selection list, making it immediately clear which configuration is in use and reducing accidental mismatches.
QEMU Integration Improvements#
v1.10.0 extends QEMU support by using idf qemu for both debug and monitor workflows, and introduces a new idf.qemuExtraArgs setting for passing additional arguments to the QEMU emulator, enabling more fine-grained emulation configuration without modifying launch tasks directly.
idf.monitorPort Setting#
A dedicated idf.monitorPort setting lets you specify a different serial port for the IDF Monitor separately from the flash port, useful when working with setups where flash and monitor use different physical connections.
Resources#
- Extension on VS Code Marketplace: espressif.esp-idf-extension
- Extension Documentation: docs.espressif.com/projects/vscode-esp-idf-extension
- EIM Documentation: docs.espressif.com/projects/idf-im-ui
- EIM Downloads: dl.espressif.com/dl/eim
- Extension GitHub Repository: github.com/espressif/vscode-esp-idf-extension
- Report an Issue: GitHub Issues
Thank you to all community contributors across these releases, including @SinglWolf, @jonsambro, @wormyrocks, @gubertoli, and @sobuch for their pull requests, and everyone who filed issues and provided feedback.